The 1 Thing That Kills 44% of Public Companies & Dents Your Portfolio Returns
Imagine buying a stock, watching it plunge 80 %… and never recover.
Imagine buying a stock, watching it plunge 80 %… and never recover.
It’s happened to nearly half of all U.S. listed companies since 1980.
That sobering statistic comes from a J.P. Morgan study that combed through 40 years of Russell 3000 price history. The authors labeled any share that fell 80 % from its peak and never clawed back as a “catastrophic loss.” It turns out 44 % of all company stocks met that fate—and some sectors were absolute investor minefields.
The Big Picture—Where Risk Hides

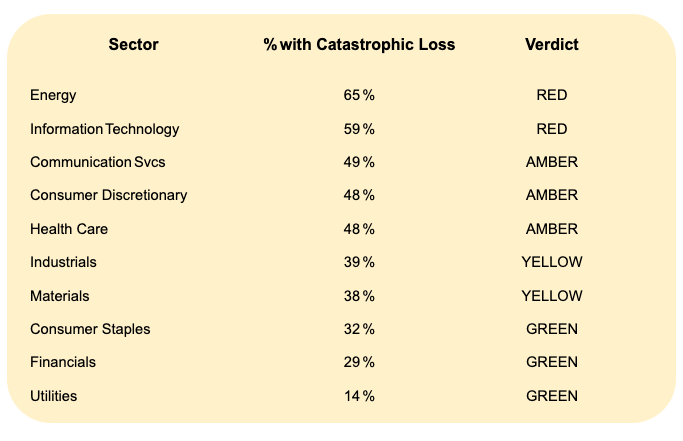
Take‑away: Two sectors—Energy and IT—have seen a majority of constituents wiped out (≥ 80 % drawdown, never reversed). Utilities, in contrast, are practically the Fort Knox of the market with only 14% of companies having been wiped out.
Why Some Businesses Endure (and Others Don’t)
Simon Kold’s “staying‑power” framework offers seven lenses for gauging whether a firm can dodge catastrophic loss :
Industry pace of technological change
Exposure to foundational tech shifts
Cultural roots of the product
Cost‑effectiveness vs. substitutes
Demographic exposures
Vulnerability to channel changes
Age of the technology / Lindy effect
Layer those lenses on the J.P. Morgan table above and the pattern snaps into focus:
Energy (65 %) is hostage to foundational tech shifts (shale, renewables) and brutal commodity cycles—high pace of change, low cultural stickiness.
Information Technology (59 %) sits at the bleeding edge; new platforms obliterate incumbents (think the shift from mainframes → PC → mobile → cloud).
Utilities (14 %) operate with slow tech evolution, heavy regulation, deep cultural embedding (“keep the lights on”) and century‑old infrastructure.
Four Famous Flameouts

Each collapse maps to at least two staying‑power determinants turning negative at once—usually a rapid tech shift plus loss of cultural relevance.
Your Defensive Playbook
Diversify ruthlessly. The J.P. Morgan data shows even “safe” sectors carry 30‑50 % loss risk. Own across styles, geographies, asset classes.
Moat analysis > product analysis. What structural advantage protects cash flows against the seven staying‑power threats? Economies of scale, switching costs, or regulated monopolies (utilities, rail) score best, so look for these factors.
Auto‑rebalancing. Periodic trimming of high‑flyers and adding to laggards forces “sell high, buy low” behavior before narrative bias begins to sets in.
Red‑flag monitor. Track R&D intensity, revenue concentration, or channel disruption (e.g., direct‑to‑consumer trends). Rising numbers can foreshadow moat erosion.
Personal‑Finance Lens—Exit Rules Before Emotions
Pre‑commit stop‑loss: Decide the %‑drawdown that triggers a sale before you buy (e.g., –25 %).
Thesis checkpoints: If a staying‑power pillar breaks (regulation, new tech, demographic reversal), exit—even if price is flat or you sell at a loss.
Use trailing stops on high‑beta names: Let winners run, but cap the downside.
Automate sells where possible: Removes the “maybe it’ll bounce” paralysis that fuels catastrophic loss.
Remember: The market will tempt you to confuse volatility with permanent impairment. Your exit playbook is the firewall between the two.
Looking for a way to track your investments (in one place)?
Visit Monopoly Hunters’ Free Resources page to download our Ultimate Investment Tracker. It’s free and lets you track all your investments in a single Google Sheet.
Bottom Line
Catastrophic loss isn’t lightning—it’s usually a slow leak in one of the seven staying‑power pipes. By seeing where sectors historically fail, studying high‑profile implosions, and wiring defensive rules into your portfolio, you can sidestep the fate that has claimed nearly half of public companies since 1980.
Stay curious, stay diversified, and stay standing.


